National Income Disparity...A Look Behind the Numbers


Over the years there has been an ongoing discussion about the growing income disparity in the United States. This discussion has been particularly emphasized when compared to the income distribution of other parts of the world. While it’s true that the US has a higher GDP per capita then all of the European Union member nations, the question is how well has the national income been distributed proportionately throughout society. One of the most commonly cited studies on the topic was done by two economists, Thomas Piketty & Emmanuel Saez in 2006. This study demonstrated a continuous trend in the widening disparity of income. So how severe is this problem ??? Unfortunately, this is not as easy of a question to answer as many would like to present it to be. So what did the Piketty/Saez study NOT tell us ???
In order to measure income disparity, this study along with many others on this topic looked at national tax return figures. This seemingly would make sense when attempting to look at income distribution. Yet when trying to benchmark this against past decades, this can be quite misleading. Over the decades the US has had dramatic changes to the income tax code that greatly impacts this data which was simply ignored by both Piketty/Saez and various other studies.
Defined Contribution Plans
Way back in 1980 an obscure portion of the tax code was spotted by a benefits consultant who noted that a 401k was a way to shelter taxable income and defer it until retirement. Throughout the 1980’s participation in 401k plans exploded. Defined contribution plans such as 401k/403b plans have become the primary source of retirement savings today. Currently, the national average employee contribution to a 401k plan is nearly 7% of an employee’s income. The national average plan balance in 2013 for pre-retirees over age 55 is about $250,000.00. Additionally, there is often an employer match which is a median contribution of 3% annually. Yet these figures do not appear on the income tax return and are totally excluded from the Piketty/Saez study. By contrast, these income figures would have been reported as taxable income rather than salary deferral as early as the 1970’s, and greatly skews a substantial portion of the national income. Furthermore, this disproportionately reflects as a greater decline in income for the middle/lower income earners because there is a contribution limit on the amount of aggregate dollars. Someone making 1 million dollars annually cannot contribute 10% of their income. They are capped at the same annual dollar amount of a middle income earner. So if a person making 100K maximizes his contribution alongside a person making 1 million annually theIr total contribution will be the same in dollars, but not as a percentage of income.
As a simple example, the IRS maximum contribution under age 50 is $17,500.00 for 2013. The individual who makes the maximum contribution with a 100k salary would have contributed 17.5% of his pay and completely removed this from the estimates of national income using the Piketty/Saez data. Yet, the individual who makes 1 million annually and makes the maximum contribution would have only sheltered 1.75% of his income and removed it from the national income data.
This will be a disproportionate skew in the reporting of national income. A study done by MIT economist James Poterba found that those in the 28% marginal income tax bracket (middle class income) held about 32% of their assets in tax deferred accounts. Yet in contrast the top 1% of earners held less than 6% of their assets in tax sheltered accounts.
Small Business Tax Laws
In the early 1980’s there were a number of tax law changes to the Federal income tax code. Among them was a change to the marginal tax rates on personal income. Personal tax rates were lowered to a level below the marginal tax rate on the corporate tax. As such there was an incentive for many business owners to transfer from a C-Corp which pays tax at the corporate rate…to an S-Corp which pays taxes at the personal rate. Since then there have been numerous other variations such at the Limited Liability Company (LLC) which also pays taxes at the personal rate. Further tax acts from 1986—1996 encouraged more and more participation in pass thru entities. Today small business profits that flow through to the personal return from businesses organized as pass thru entities (such as S-corps/ LLC’s etc) now account for about 25%-30% of the income of the top 1% of earners. Yet in 1981 this was only about 8% of their reported income. The number of business returns filing as S-corps has increased at an annual rate of about 9% per year since the 1986 tax act. What ultimately happened was not so much that income rose substantially for the highest earners, but rather a substantial portion was simply reported as personal income rather than corporate income. This shift in small business income accounts for nearly 5% of the current increase in disparity between the top 1% of earners and the other 99% cited by the Piketty/Saez study.
Let’s also not forget that many of the deductions that were used by high end earners in the 1950’s to hide income are simply unheard of and not available today. One of many examples would be passive activity losses. For example, in the 1950’s a doctor or attorney could often reduce their taxable income to near ZERO by taking depreciation and paper losses on real estate they owned through Real Estate Investment Partnerships. If you made 50k per year…that might hypothetically correspond to 500k today. Yet today that deduction would be maximized at 3k per year, a much smaller percentage of income and producing a much greater amount of taxable income. Yet in the 1950’s signing up for money losing schemes on paper was big business. It had become in many ways an accounting art form. Yet with the changes to the tax code in the 1980’s, many of these deductions which were quite uneconomical were tossed out. So were many others such as credit card interest being eligible for a tax deduction.
These shifts in how income is reported is hardly a change in the distribution of income. Yet once again the Piketty/Saez study and most others simply excluded such facts.
Employee Benefits
Should we choose to rewind the clock further in the economic history of the United States, we could look at other fringe benefits. The Stabilization Act of 1942 exempted fringe benefits such as health insurance from caps on wages and salaries. So in an attempt to compete for labor, employers began to offer health insurance as a benefit of employment. This was the first step towards employer driven health insurance. In 1949 the National Labor Relations Act classified health insurance as wages. Yet, from a tax perspective insurance is not treated as a taxable benefit. Over the years, more and more employers began to offer health insurance as the norm. Yet in the early 1950’s this was not the case. Most people paid a doctor out of pocket. Today, as many of us know full well…a family of four could cost 15-25k in insurance benefits annually. Much of this is often subsidized by the employer. Today about 45% of Americans receive their benefits through their employer. Although due to rising cost and an aging population, this statistic has been in decline. Currently the largest insurance provider in the nation is the US gov’t through programs such as Medicare. Nevertheless, the percentage of workers in the labor force receiving this benefit through their employer is dramatically higher than the 1930’s-1950’s. Additionally there are numerous other tax exempt benefits that employers offer employees. Today the national average cost to an employer in benefits paid is approximately 30% of annual compensation which is also not typically reflected in income disparity figures.
Existing Transfer Payments
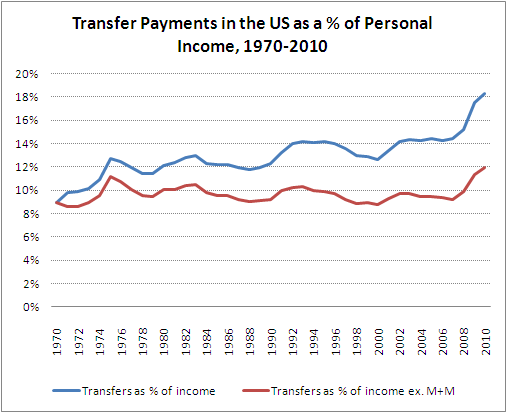
Transfer payments are forms of income transfers from one part of society to the other. These can take various forms that are direct or indirect. They may be welfare payments, earned income tax credits, healthcare programs or even food stamps. Data from the Bureau of Economic Analysis demonstrates that in 1970 wages and salaries accounted for approximately 65% of personal income and transfer payments equaled approximately 8% of national income. Today the national income is made up of approximately 55% in wages and salaries, while transfer payments equal approximately 18% of national income. It should be noted that a good percentage of this is related to national entitlements like Social Security/Medicare/Medicaid. Yet, many Americans on the lower end of the income spectrum receive more benefits from these programs then they contribute over their lifetime. The average Medicare recipient receives more than 100k in lifetime benefits than they contribute according to a study done by Douglas Brandow, a Senior Fellow with the Cato Institute. Rather than debate the efficacy or morality of these programs, it should simply be noted that this data is also excluded from many of the studies around growing income disparity such as the Piketty/Saez study. With an aging population of baby boomers, this trend will likely continue. Yet is still a major distortion in the distribution of income data.
Tax Units vs Households
Their work also makes reference to tax units in comparison to households. This is a function of examining tax returns and not families in enough detail. It was noted that
"The average household income was about 30% higher than the average tax unit’s income."
In reality it can be much larger than that. Two people whom are not married but choose to live together are one household…but two separate tax units. Their household income could be twice as large as their tax unit income.
Let us also not forget that if a child has more than $6,200 dollars in earned income or $1,000 of unearned income ($750 back in 2006 when his work was first published)…they must file an income tax return. They are now considered to be tax units. So even though they are poor tax units in regard to their work around income disparity…they may in fact come from very well off families. Now is it really a fair comparison to look at a young student in college working a part time income, or even a kid with some stock that granny gifted and has some dividend and interest income…and subsequently measure them against a 40 year old full time truck driver ?
Income Rotation & Mobility
Another aspect often missed is how much of one’s income is also related to capital gains. Small business owners every year sell their businesses for as much as 2-3 times annual revenue depending on the industry. That spike in onetime cash flow moves a substantial number of people into a top bracket on a onetime basis, only to see them drop back down to a lower income. This is also true when someone of a modest income sells a piece of property that produces a onetime capital gain. To portray this as a consistent income stream is misleading at best.
A study done by the US treasury around income mobility found that about 25% of those in the top 1% of earners in 1996 were no longer in the top 1% by 2005. The same study demonstrated there was a considerable degree of income mobility in the US. More than 55% of tax filers moved to a higher filing bracket between 1996-2005. More importantly, of those in the lowest brackets...at least 45% of them moved to a higher income bracket. In reality, there is a great degree of rotation among those who are top earners on a year over year basis.
http://www.treasury.gov/resource-center/tax-policy/Documents/incomemobilitystudy03-08revise.pdf
Capital Gains
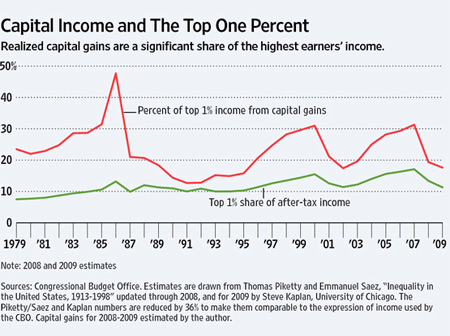
Additionally, annual stock market returns can greatly impact ones tax reporting. In 1986 during a relatively bullish market, the top 1% of earners realized approximately 30% of their income from capital gains. Yet during the recession of the early 1990’s that figure fell to about 5% in 1992. As a result, this is not always the result of much higher wages, but rather when one chooses to realize income based on the tax code. Lower capital gain rates encourage one to realize a gain, and increase their reported taxable income. Yet while the Piketty/Saez study excluded transfer payments, they opted to include capital gains as though it was traditional income. However, as the chart below provided by Alan Reynolds of the Cato Institute demonstrates...when adjusted for realized capital gains, the income of the top 1% has not increased at nearly as rapid a pace as many studies suggest.
It is also important to note that capital gains, unlike earned income requires one to first risk capital. You cannot achieve the gain unless you were initially willing to invest the capital and potentially lose it. This is quite different than income from employment, in which an individual can only lose their position, but not their skill set. An investment once lost in a capital investment venture is gone permanently.
Another issue related to capital gains, is that after the 1986 tax act…capital gains had gone up and ordinary income rates came down. Suddenly, there was a surge in the use of Non-Qualified stock options as form of compensation. Because unlike incentive options they are not taxed at capital gains rates, but treated as ordinary income. Now if you’re an executive…in 1975…you negotiate your deal so that your paid in incentive options…because you don’t want to pay at the 70% marginal rate. Now it’s 1987…and you’re happy to take your income in Non-Qualified options…and get taxed at the 28% rate for ordinary income. So you renegotiate the arrangement. This is just another form of income shifting from capital gains to ordinary income. Note that this is not a change in income…or more income…it is simply reported differently. And Non-Qualified options plans became a significant source of income to top exec’s. Virtually all option gains were treated as capital gains prior to the 1980’s.
Immigration
As many of us know, immigration is a hotly contested subject. Regardless of one’s political position, It cannot be debated that the US has a great deal of both legal and illegal immigration. The reality is that most immigrants come to the US from impoverished backrounds looking for a better opportunity in the US. As a result those that are here legally and reporting their income immediately import a degree of poverty on our income distribution data. It should be noted that immigrants statistically are more likely to start their own business and become self-made millionaires than a natural born citizen of the US. The Kauffman Foundation’s index of entrepreneurial activity is almost 40% higher for immigrants than for US born citizens. However, immigration is not a onetime event, but rather it is ongoing. Population growth due to immigration has grown by nearly 60% since 1990. The aggregate tax returns filed by new immigrants also has a disproportionate effect on the lower end income distribution, regardless of whether or not they eventually work their way up the economic ladder in years to come.
Dividend Income
In 2003 the tax rate on what became "Qualified" stock dividends fell from 35% to 15%. Subsequently, the portion of income derived from dividends among the top 1% of earners doubled from 4.2% in 2002 to 8.4% in 2007. This was simply a shift in investors moving from the tax free treatment of municipal securities and tax sheltered accounts, to investing in individual stocks for their income outside of tax shelters as a result of the more favorable tax treatment. Yet another example of income shifting rather than increased income inequality.
As part of the 1986 tax act...beginning in 1987 interest derived from tax free municipal bonds was now required to be reported on a 1040 even when it was not taxable income. However, prior to 1987...there was no way to track this income since it would not appear on a tax return. So what is now close to a 4 trillion dollar market can be found a tax return. These investments paid double digit tax free interest rates in the early 80's and flew completely below any tax reporting radar available.
Of course there is always the unreported income that is generated from cash transactions. However, the transactions that occur in the shadows are very difficult to quantify.
These are just a few data points that illustrate that the income disparity figures are quite misleading when compared to a historical analysis of US economic history. There are other factors that affect reported income such as interest earned from tax free municipal securities, and the various itemized tax deductions associated with self-employment.
In reality there is and always has been a disparity of income distribution. There will always be a disparity in a free market. Some of us are smarter and more innovative than others. Some of us are willing to make sacrifices that others are not. But the data behind the data suggests that the widening distribution of the income is not nearly as pronounced as some studies have suggested by simply looking at personal income tax returns. There is in my view a great deal of data to suggest that the purchasing power of the income realized has consistently been in decline for nearly a century. This is more a function of monetary policy as well as how we calculate the cost of living. Price stability is a different topic altogether, which I believe is a better explanation of why many Americans may feel that their standard of living has been strained in recent decades.
Yet from a policy perspective, in recent decades there have been numerous policies in place that encourage lower end earners to defer income and save for retirement. While simultaneously encouraging many wealthy individuals to declare more income that would have otherwise not been reported as personal income, or simply not reported at all. Such policies that encourage savings are healthy. However, they should not be construed to represent a major fundamental change in the distribution of income when compared to past decades.
Suggested Reading
- How to Invest in Bonds
Fixed income investing is vital part of the investment planning process. Any sound asset allocation strategy will have at least a partial exposure to fixed income. The definition of fixed income is quite broad. Included in this category would be... - Preparing For The Tax Law Changes In 2013
The topic of taxes is always one which is greatly debated from both a political as well as an economic perspective. Regardless of one’s political persuasion on such issues, one constant always remains the same. We each do all that we can to avoid... - Should We Return To The Gold Standard ???
The discussion of monetary policy is a complicated one with many aspects that are often misunderstood by the general public. The discussion of the Gold Standard in recent years has been brought back to the forefront by some in American politics,... - How Government Programs Increase Costs
Many of us look at the cost of things we need to buy and often get frustrated with how expensive certain aspects of the cost of living have increased. Yet often we really don’t take the time to try to understand the root cause of exactly why... - Understanding Medicare Benefits
Health care is an area of major political and economic debate, and many of these laws may be substantially altered in light of potential legislative changes, coupled with the enormous fiscal challenges the current programs like Medicare & Medicai - Managed Futures: An Alternative Investment Strategy
The core principles of applying investing to a sound financial plan have for more than a half of a century revolved around the work of Harry Markowitz, and the foundation he outlined for Modern Portfolio Theory (MPT). Yet, in recent decades we have.. - How to Understand Floating Rate Notes
In recent years we have seen unprecedented actions by global central banks to influence economic events and create monetary stimulus. Here in the Unites States, the Federal Reserve has held interest rates well below historical norms through... - ETN's vs ETF's: A Note of Caution
The exchange traded product (ETP) market seems to be growing more rapidly year over year. The lower expenses when compared to the traditional mutual fund universe has made them very attractive to both individual and institutional investors. The term. - Understanding The Long/Short Strategy
The single most important factor in a successful long term asset allocation investment strategy is the ability to maintain a low correlation between asset classes. In order for the notion of an asset allocation to work, a portfolio must be actively.. - The Benefits of Master Limited Partnerships
A Master Limited Partnership (MLP) is a partnership which has the ability to trade on a public securities exchange. There are two core components which are the Limited Partner and the General Partner. The Limited partner is the investor who puts up..